Operate
Dashboard
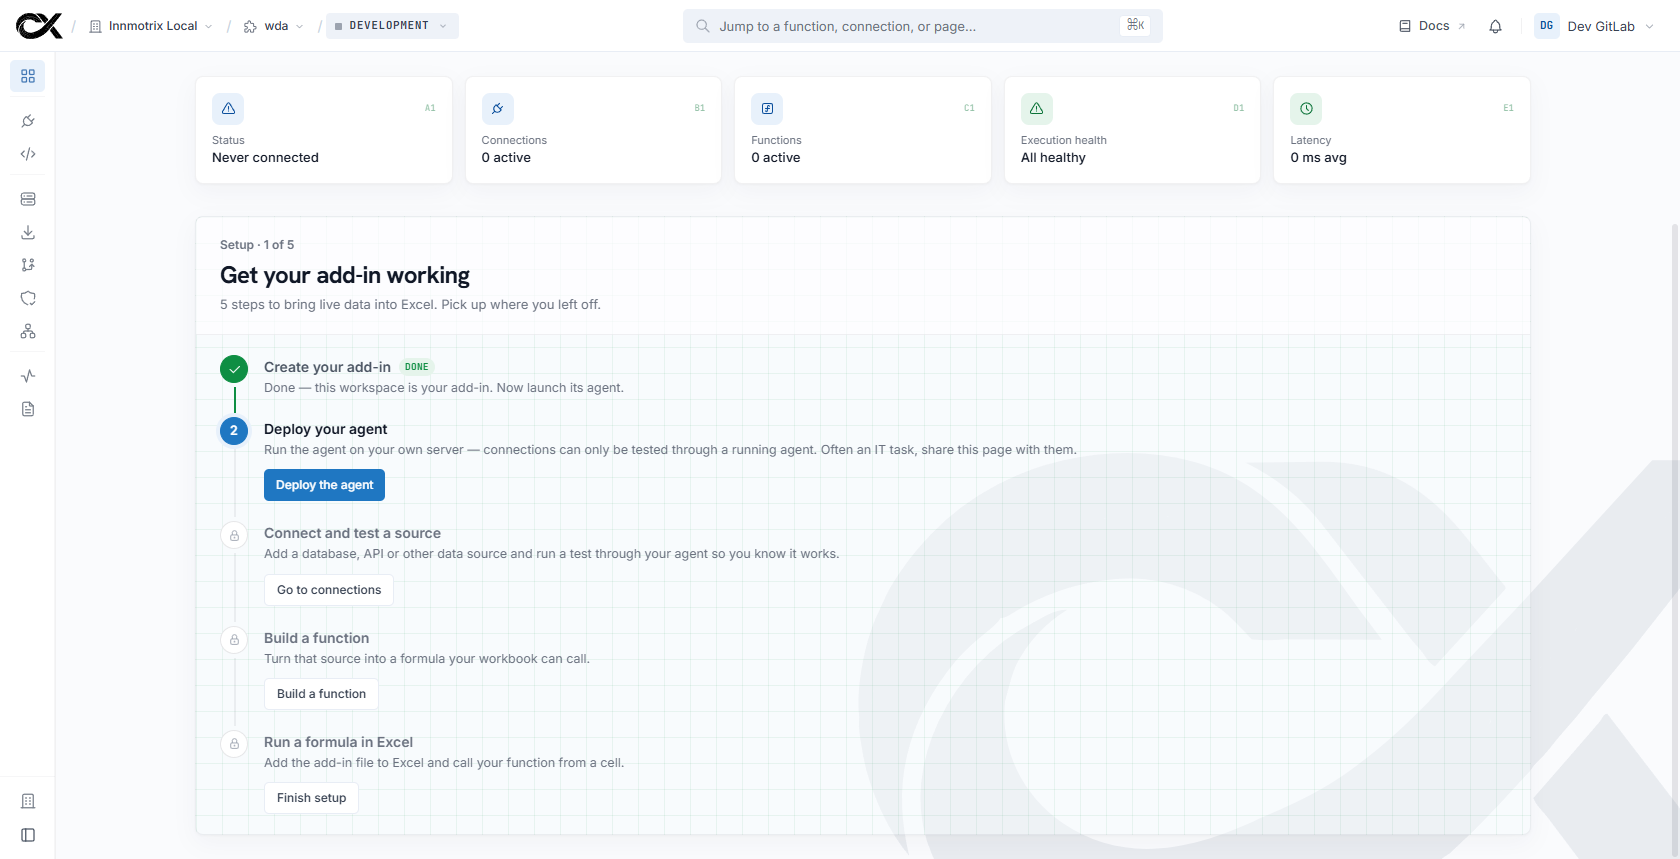
The dashboard is where you configure add-ins and watch the agents that serve them. Everything is scoped by the URL — organization, then add-in, then environment — so the breadcrumb tells you exactly what you're editing.
6 min read
How the app is organized
The scope narrows left to right: your organization owns add-ins, each add-in owns environments, and most resources live inside one environment. The topbar switches the add-in and the environment; the sidebar switches the section.
- Add-ins — the list of add-ins, and each add-in's runtime page (see below). This is the top-level thing you create and switch between.
- Connections — the data sources for the selected environment, with create, edit, and test. See Connections.
- Resources — everything Excel-facing, in one tabbed page: Functions, Data types, Assets, Ribbon buttons, and the Taskpane builder. See Resources, Taskpane, and Ribbon buttons.
- Access — per-function access rules and the sign-in provider. See Access control.
- Environments — rename, cache configuration, and other environment settings. See Environments and Versions for the config history and diffing.
- Telemetry and Logs — usage analytics and exports. See Logs & exports and Alerts.
- Organization — members and roles, notification webhooks, billing, and support. See Members & roles and Billing.
White-labeling the add-in — display name, icon, ribbon tab, and formula namespace — lives under Resources too; see White-label. If something looks wrong anywhere in the dashboard, Troubleshooting is the first stop.
The agent runtime page
Open an add-in to see the agent for the selected environment. Remember each environment runs its own agent, so the page reflects one environment at a time. It shows:
- Instances (replicas) — every running copy of the agent, with hostname, version, uptime, last-seen, and its live host health.
- Health — CPU, memory, and disk gauges per instance and a 24-hour timeline, plus the alert thresholds card (see Alerts).
- Versions — the binary versions this agent has reported over time, so you can spot a replica that's behind. See Versions for the config-side history.
Commands you can send an agent
From the runtime page you can send a live command to the agent over its control channel. The set is fixed and acknowledged — the agent only ever accepts these:
reload_config— re-pull the latest configuration now.drain— stop taking new calls and let in-flight ones finish (before a restart).test_connection— probe a data source from inside your network; see Connections.get_logs,run_diagnostic— pull recent logs (see Logs & exports) or run a self-check.
Commands are agent-initiated and safe
The agent opens the control channel outbound to this backend, so commands reach it through your firewall without any inbound port. Anything outside the fixed set is rejected on both ends.
White-labeling
Replace every ConnXL mark your end users would otherwise see — the add-in's name, its icon, the ribbon tab, and the taskpane's whole look — with your own brand, sourced from one shared assets library.
Environments
An add-in owns an ordered set of environments — Development, QA, Staging, UAT, Production — and each one runs its own agent, independently live. This page covers renaming, the per-environment result cache, and how configuration moves between environments.